Optimization is a hard process. When you create a business intelligence (BI) solution, you want that your queries return the data with lightning speed, no matter whether they retrieve the data from a Power BI semantic model or a data warehouse (DW). In addition, you have a limited time window for the daily extract – transform – load (ETL) process. Extract is done from the source transactional, line of business systems. You also want to have as small impact on the source systems as possible. This seminar presents a holistic view on the optimization of a BI solution. Although the seminar is focused on a Power BI for the analytical part, it is useful if your on-line analytical processing (OLAP) uses SQL Server Analysis Services as well.
This seminar presents many ways how to measure the performance and the impact of different possibilities. It helps you to understand which parts of the optimization are really important, and which parts might not improve the performance so much as you would wish. After this seminar, you will be equipped with the knowledge and the code needed to measure and improve the performance of your BI solution.
Abstract
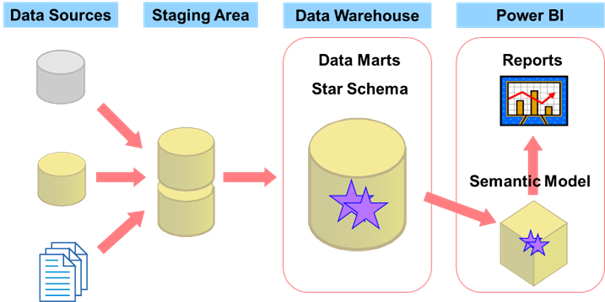
The seminar starts with optimizing ETL. When you try to optimize Power BI, the first advice you get is to push the data processing as far upstream as possible. Query folding in Power Query tries to enforce this logic as much as possible. But what is going on SQL Server side? What if the daily extract – transform - load (ETL) process is still too slow? The real optimization of the ETL process starts with finding what has changed on the source, finding the delta. In SQL Server, you have many methods for this. You can use the Change Tracking (CT), Change Data Capture (CDC), system-versioned tables, ROWVERSION data type, triggers… Which method might be the fastest? In the next step, how do you optimize staging tables? Do you use regular tables, temporary tables, memory-optimized tables? Can you leverage minimally logged operations? Does it make sense to pre-aggregate the data? Disable indexes and constraints or not? What about table partitioning?
Then the seminar switches to DW optimization. Even if you use Power BI to create majority of your analyses you need, you many times have to query and create reports directly from your data warehouse (DW). In addition, Power BI can operate in DirectQuery mode, where the data is stored in the DW, and Power BI serves as the client tool only. In short, you also have to know how to optimize Transact-SQL queries. So, what are the problems with analytical queries? Do you know how SQL Server can help you with them? Well, SQL Server can do it in many ways: with special joins and indices, with data compression, with window functions, but especially with columnar storage. Columnstore indices in SQL Server use the same storage as the semantic model in Power BI. How much do you gain from columnar storage? How much does the column cardinality influence on columnstore compression? Unlike in Power BI, you can update the columnstore indices in a SQL Server DW.
The seminar finishes on the Power BI side, including optimization of the semantic model and the reports. Power BI was created for lightning speed of reports. Nevertheless, it is still good to know how to create efficient datasets, efficient semantic models. You will learn how natural and even artificial hierarchies can help guiding end users to create efficient reports. It is quite important how you write DAX formulas for complex measures. You probably heard about query folding, a capability of Power Query to push processing down to the source as much as possible. Does it always give you the best possible performance? What about data science analyses optimization? You cannot process billions of rows with advanced visualizations, including R and Python visuals. You can help yourself with data sampling. You can also do a lot in the reports side, once the data model is already optimized. In Power BI Desktop, you even have the Performance Analyzer tool that helps you with this task. You learn also how to use aggregate, dual mode and hybrid tables in Power BI.
Target audience
This seminar is intendent for database and BI developers and administrators who want to optimize their existing or create a new optimized BI solution.
Prerequisites
Attendees should understand with key concepts of business intelligence and data warehousing. They should have working knowledge of T-SQL and be familiar with Power BI.
Modules
- Optimizing ETL on SQL Server Side
- Optimizing a Data Warehouse
- Optimizing Power BI Semantic Model and Reports
 Optimizing a (Power) BI Solution End-to-End


